Best JavaScript Charting Libraries
Data visualization is the most discussed topics among companies these days. Data is the very powerful tool but sometimes it is very hard to understand it in text format hence visualization is used. There are many tools are available these days for data visualization.
Best JavaScript Charting Libraries
By using data visualization we will get the best possible results even when the data is large or complex. in today’s business environment a large amount of data is collected and analyzed. These days, companies need data quickly and efficiently. Data visualization is much faster and easy for people to understand the data when they are displayed in charts and graphs.
It is easy to understand, but it is not easy to build. building UI for data visualization is a hard job for developers, especially in this Mobile era. Luckily there are some good JavaScript Charting Libraries are available to make the life easier.
In this post, we have gathered a list of great JavaScript Charting Libraries for data visualization.
ECharts
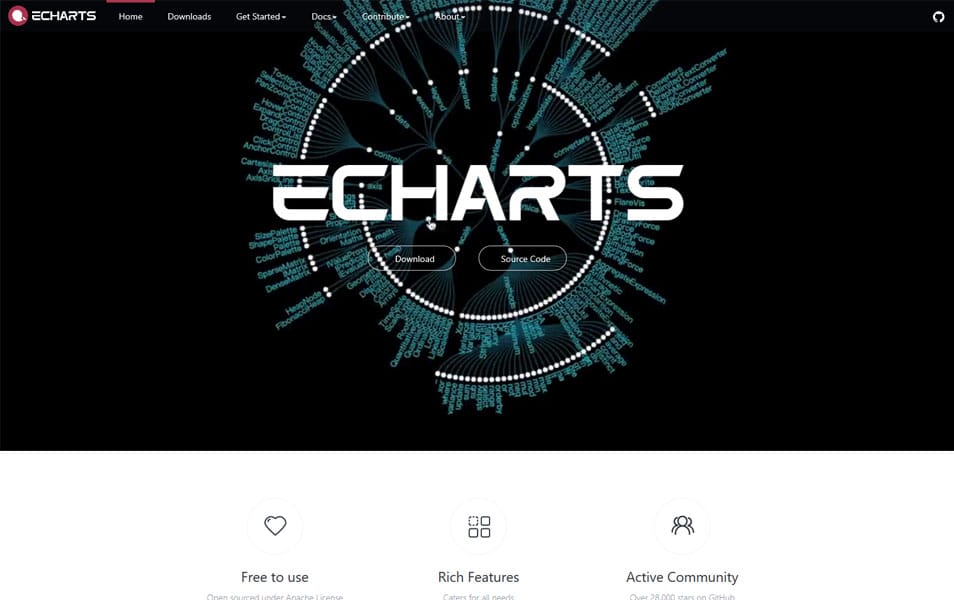
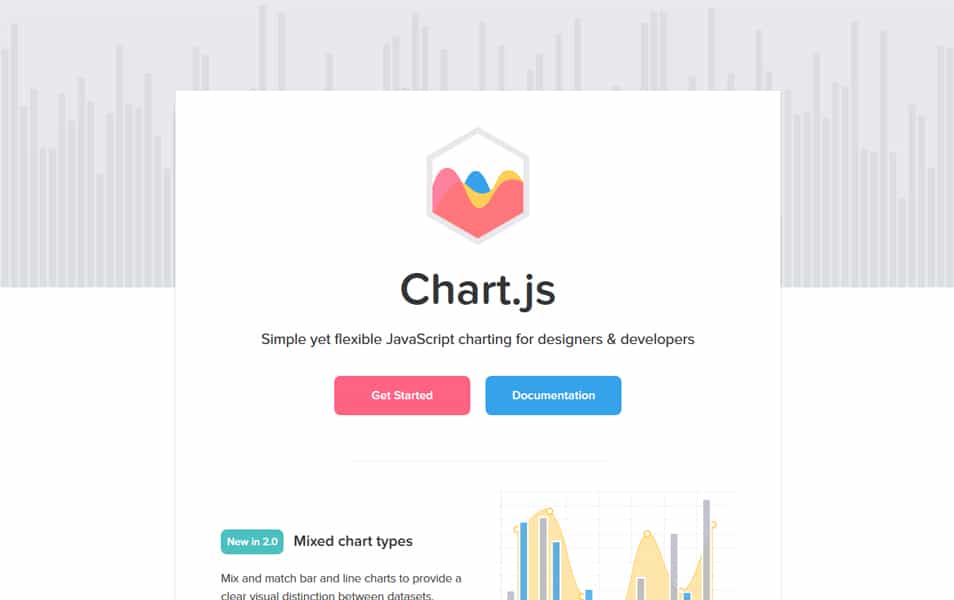
Chart.js
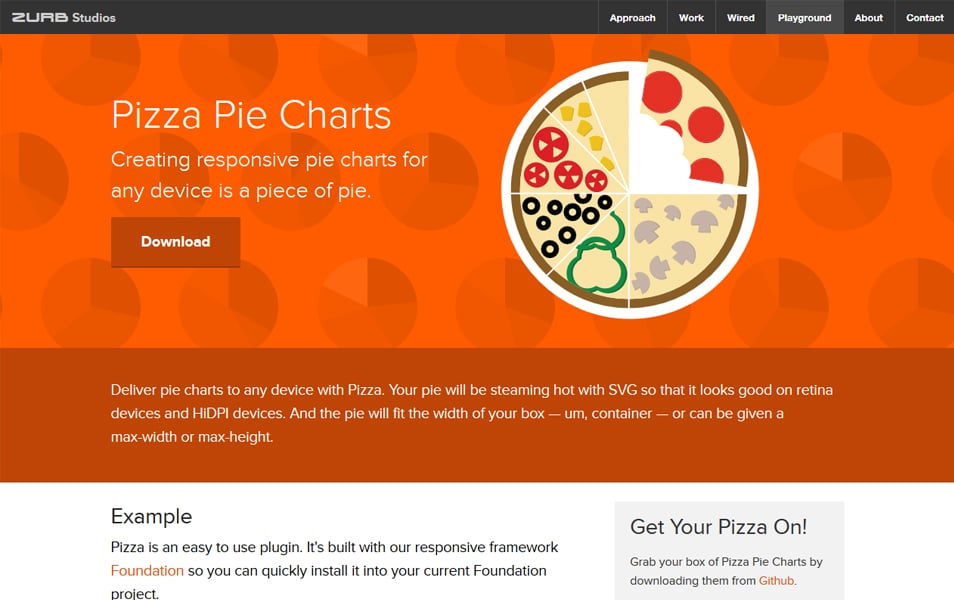
Pizza Pie Charts
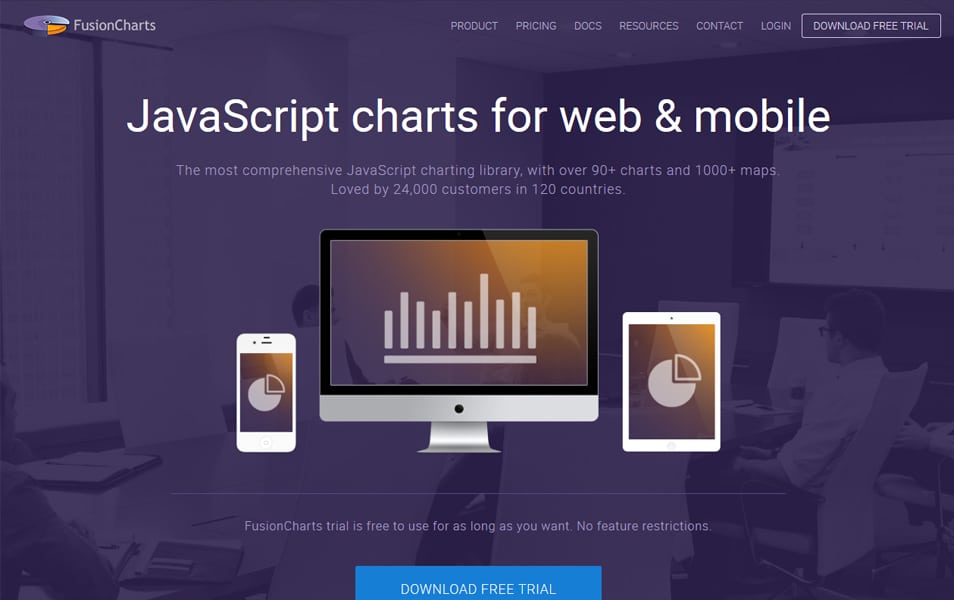
FusionCharts
Google Chart
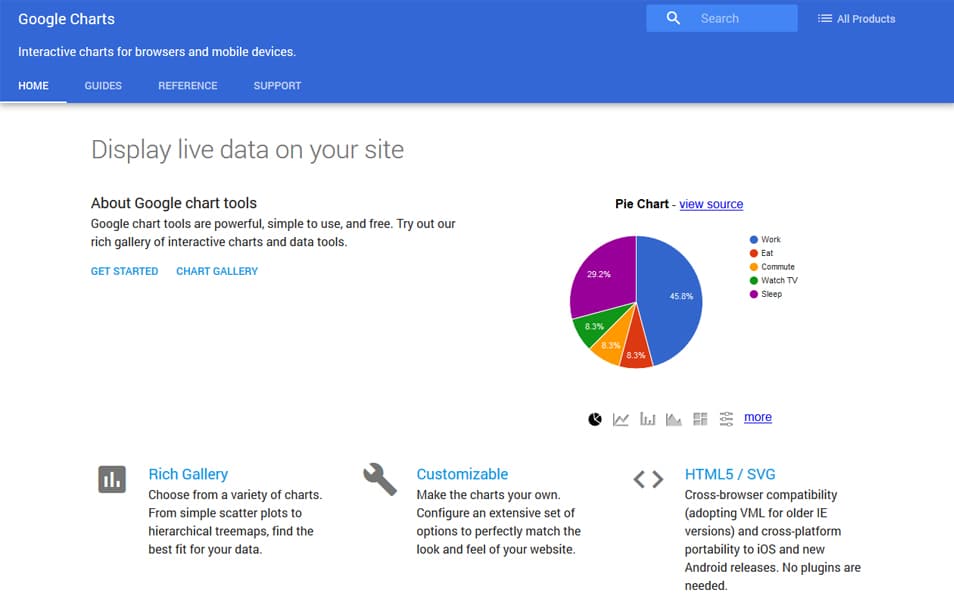
PlusCharts
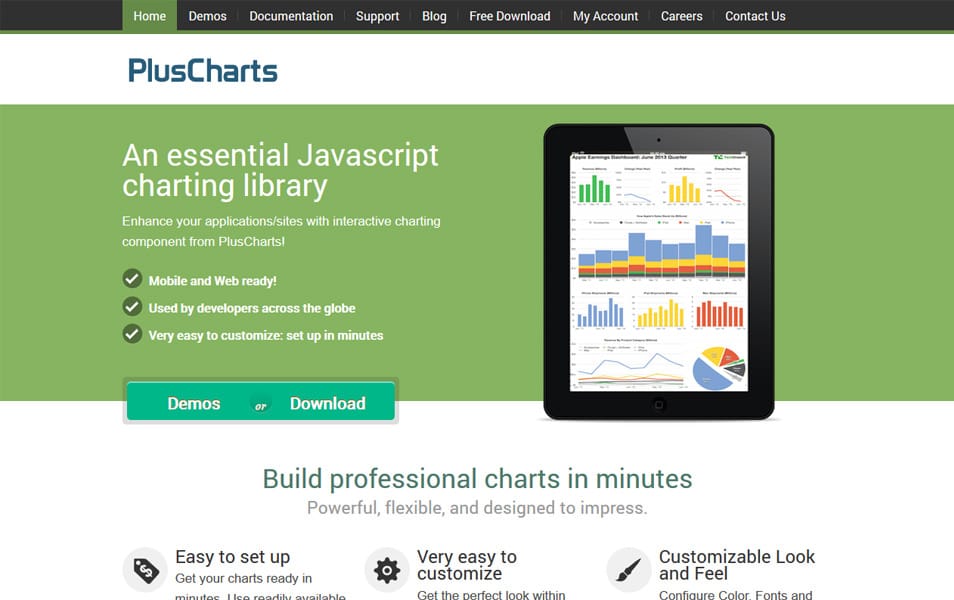
Highcharts
D3.js

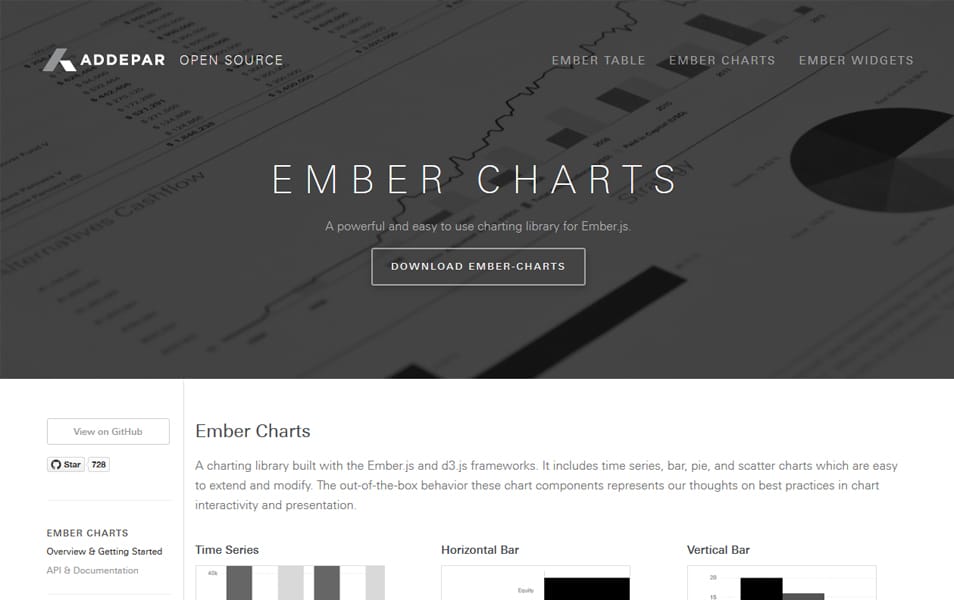
Ember Charts
Plottable.js
amCharts
EJSCharts
AnyChart
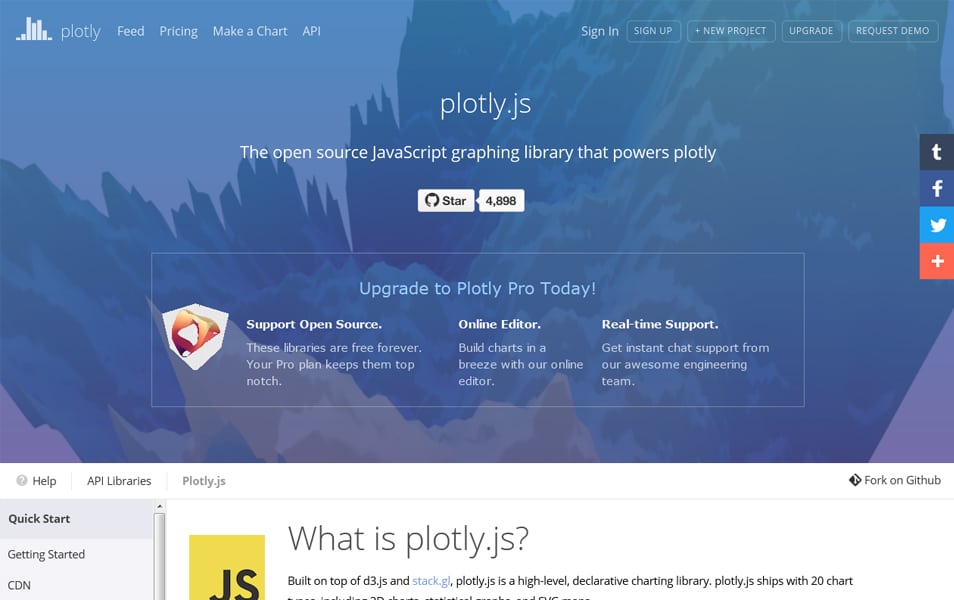
plotly.js
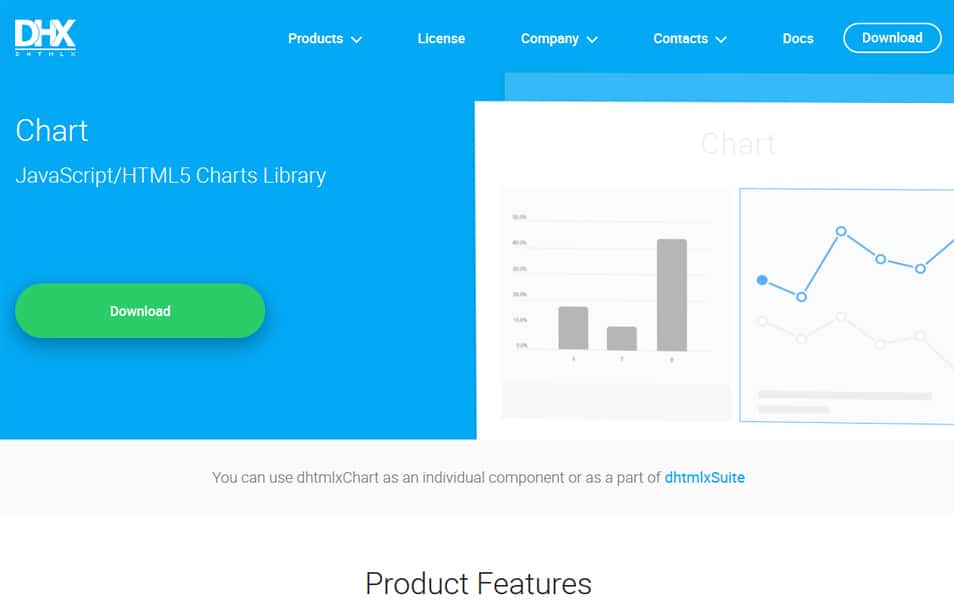
DHTMLX Charts
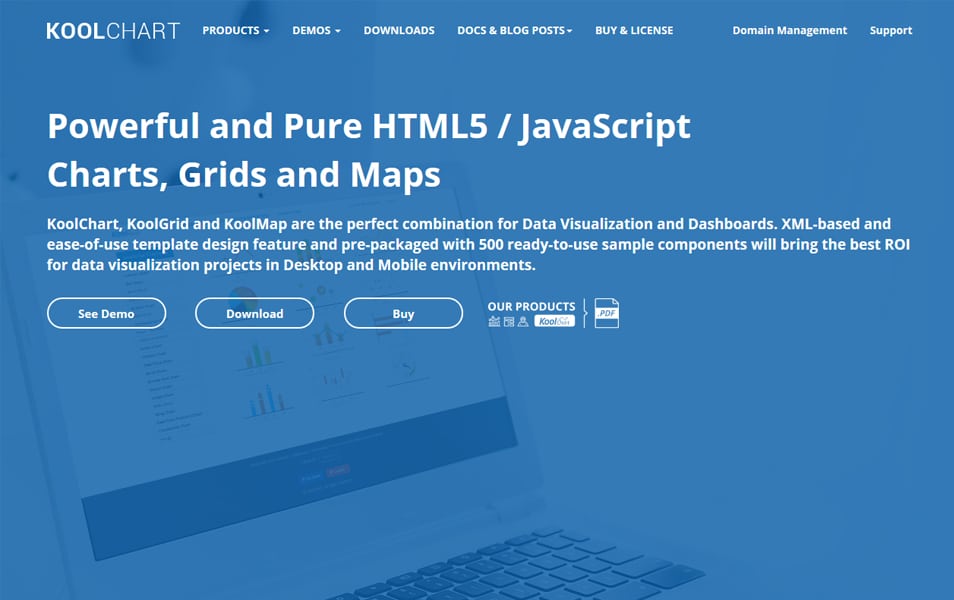
KoolChart
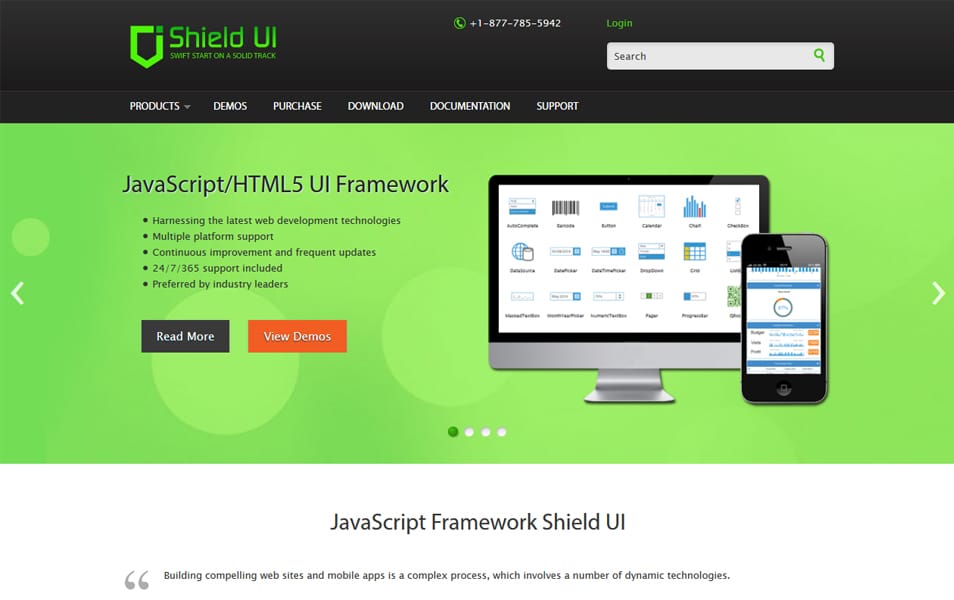
Shield UI
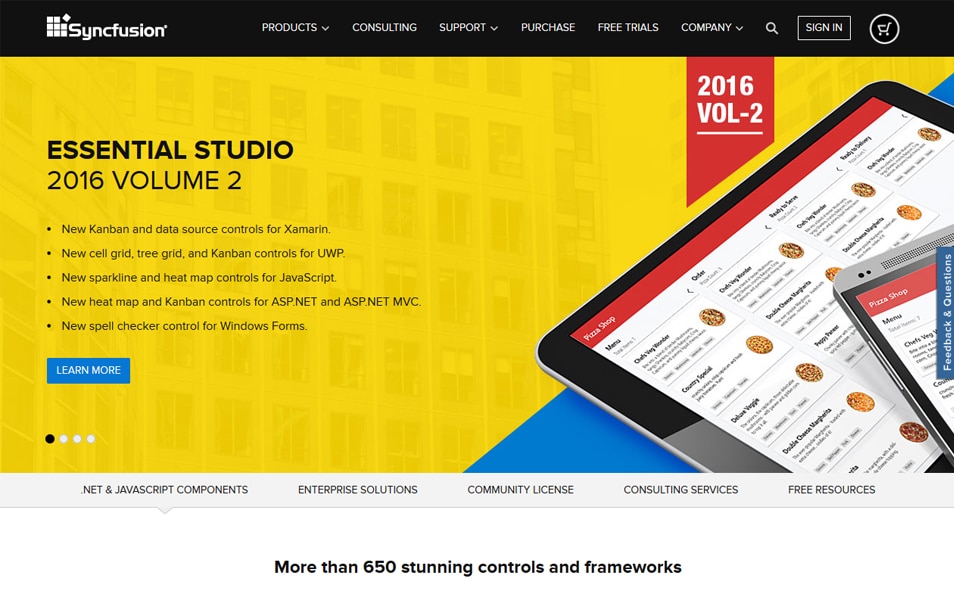
Syncfusion
Steema

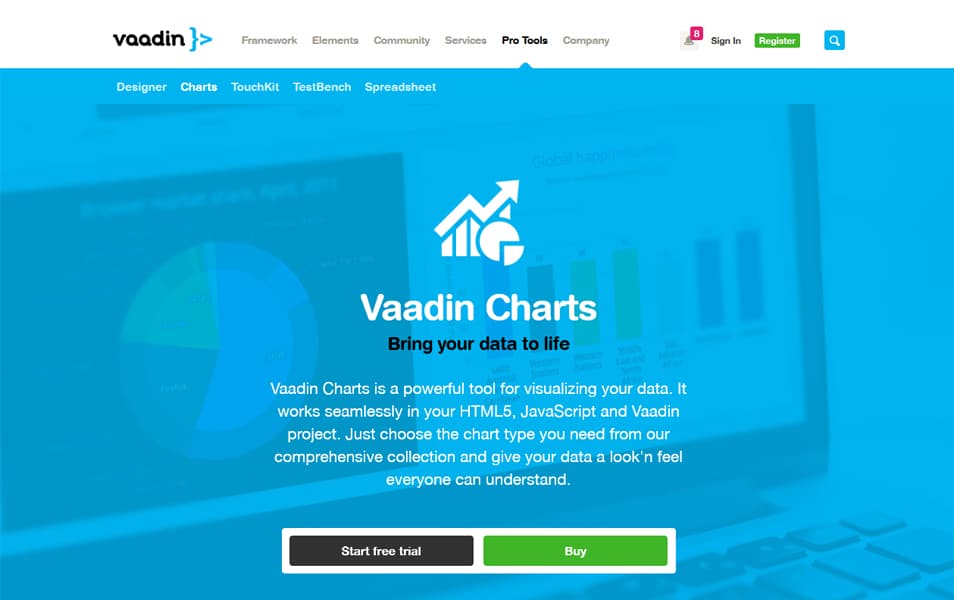
Vaadin Charts
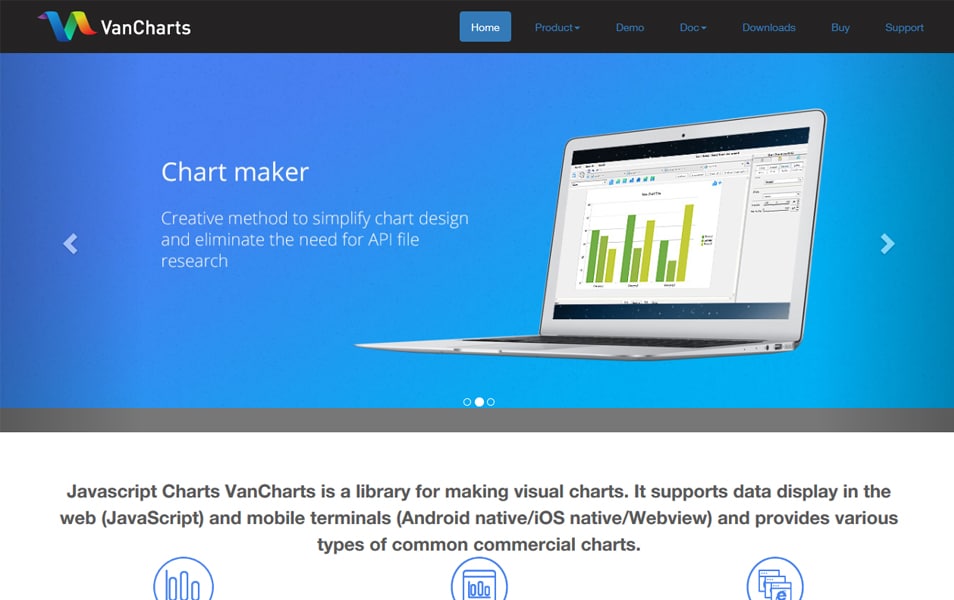
VanCharts
ZoomCharts
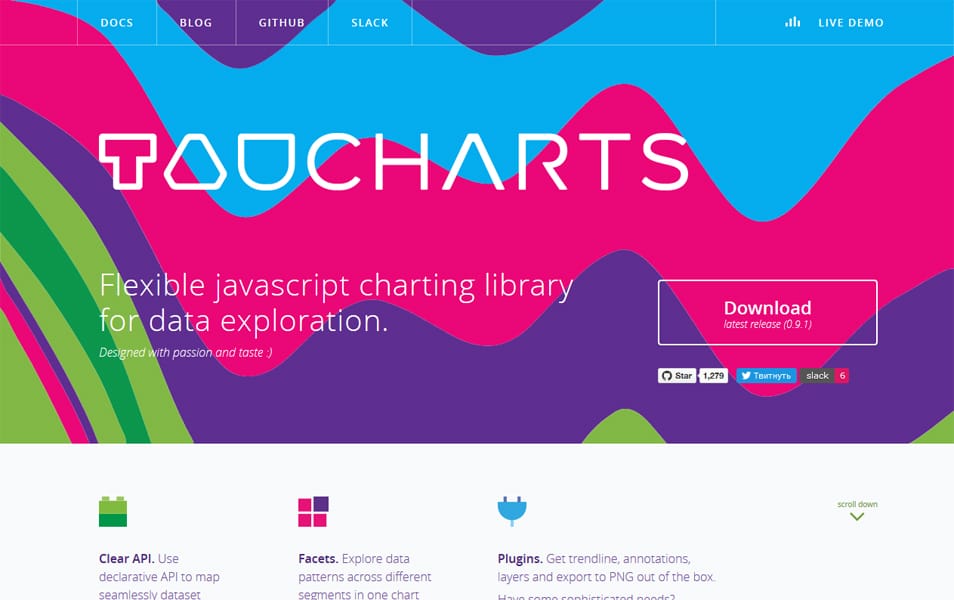
Taucharts
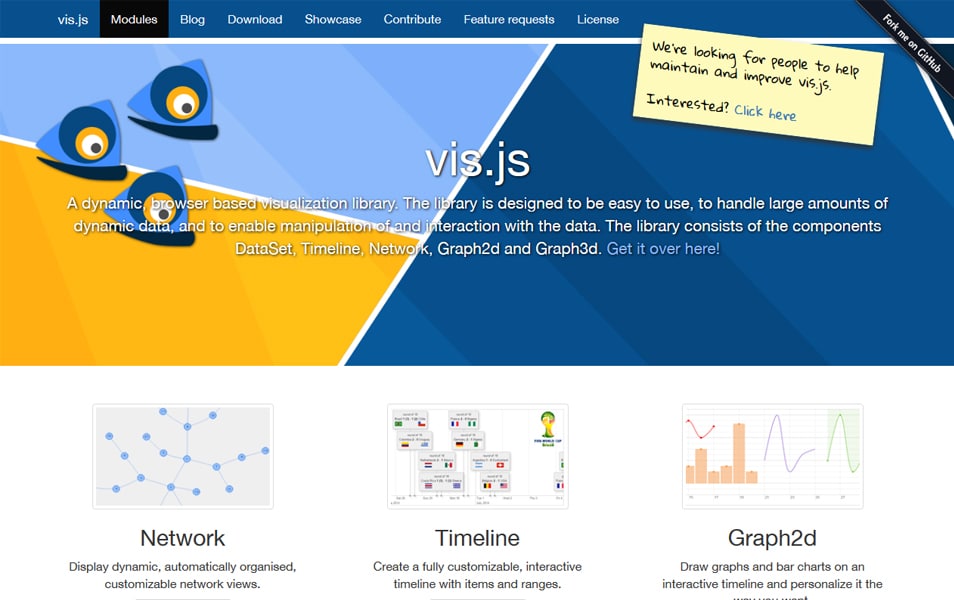
vis.js
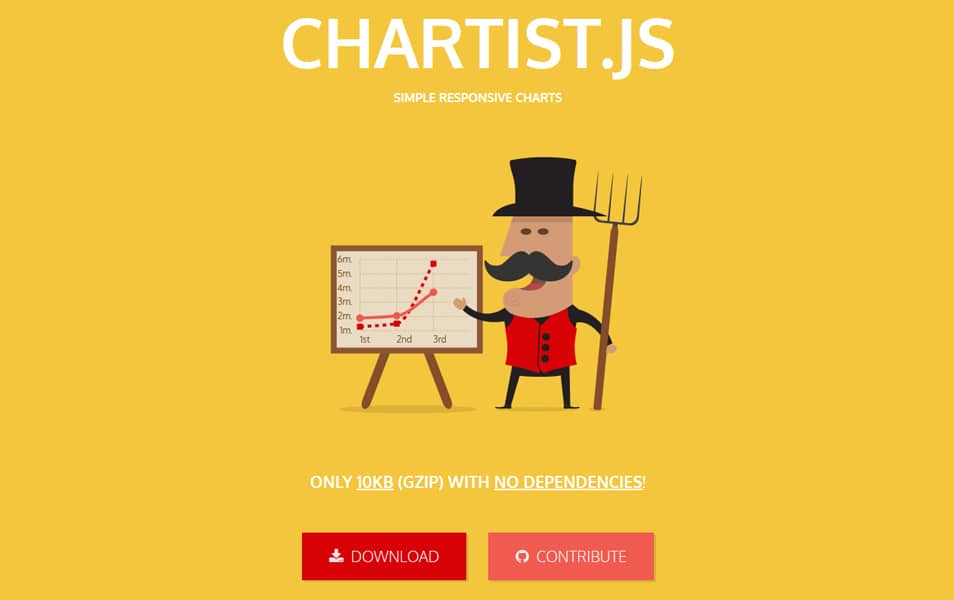
Chartist.js
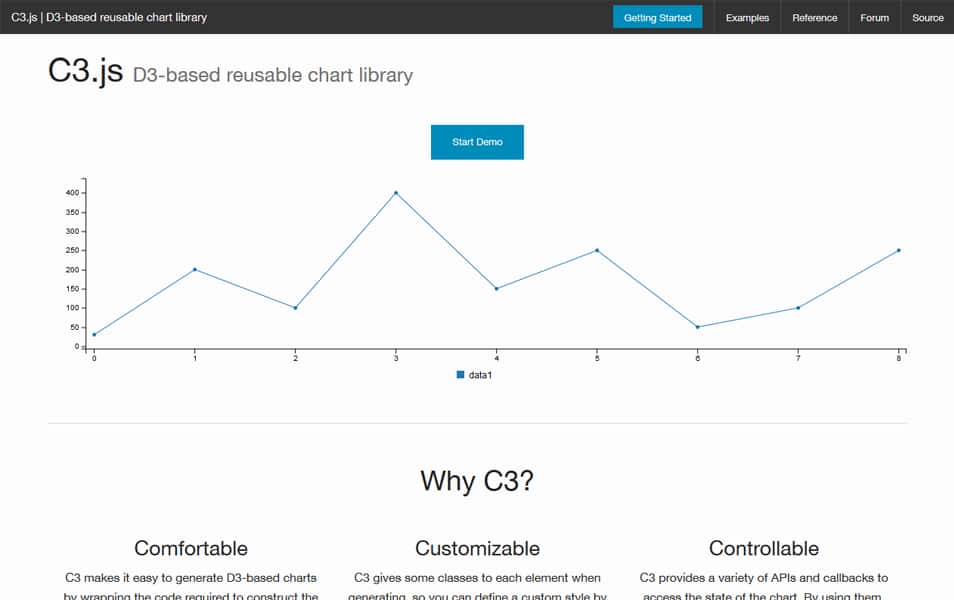
C3.js
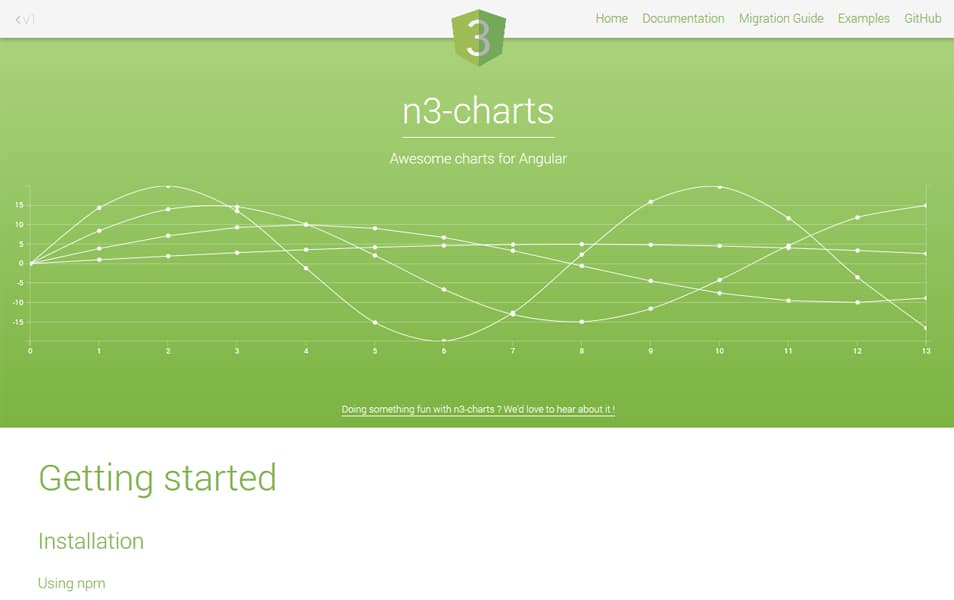
n3-charts
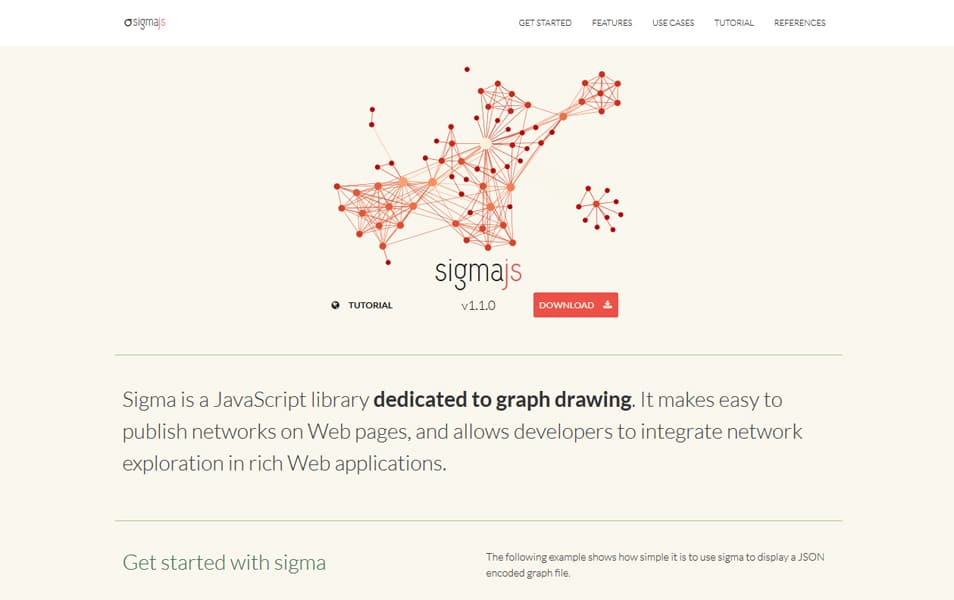
Sigma js
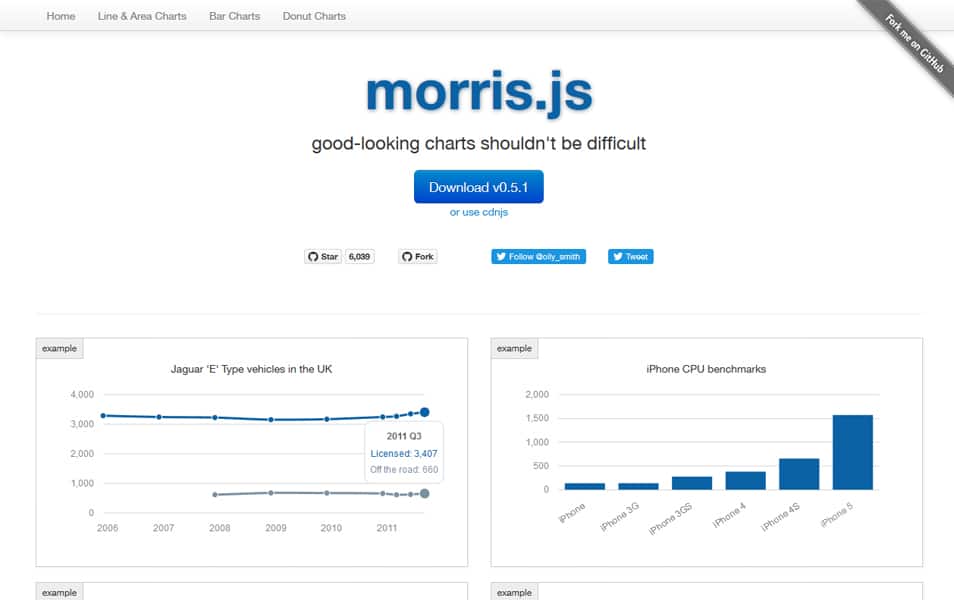
Morris.js
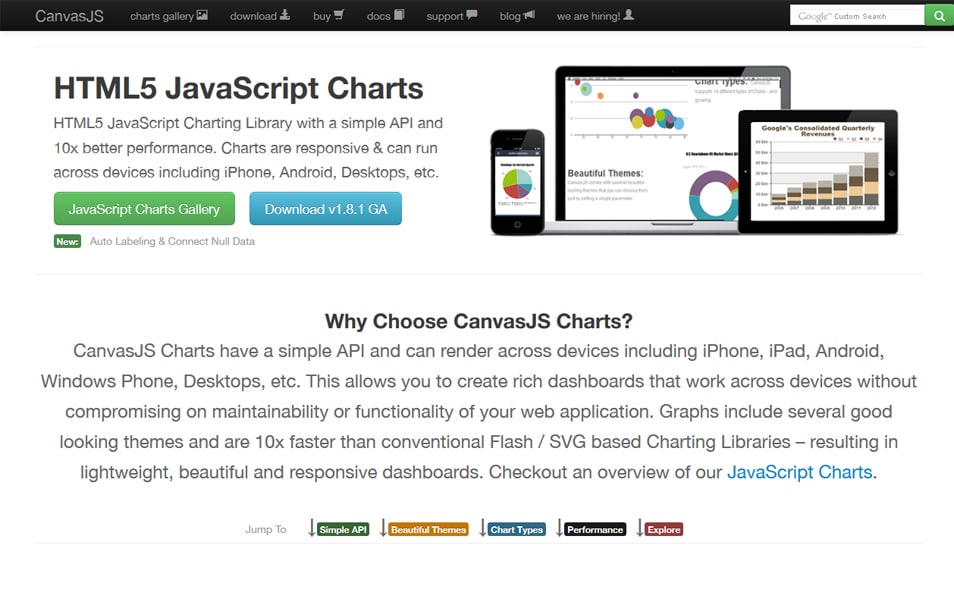
CanvasJS
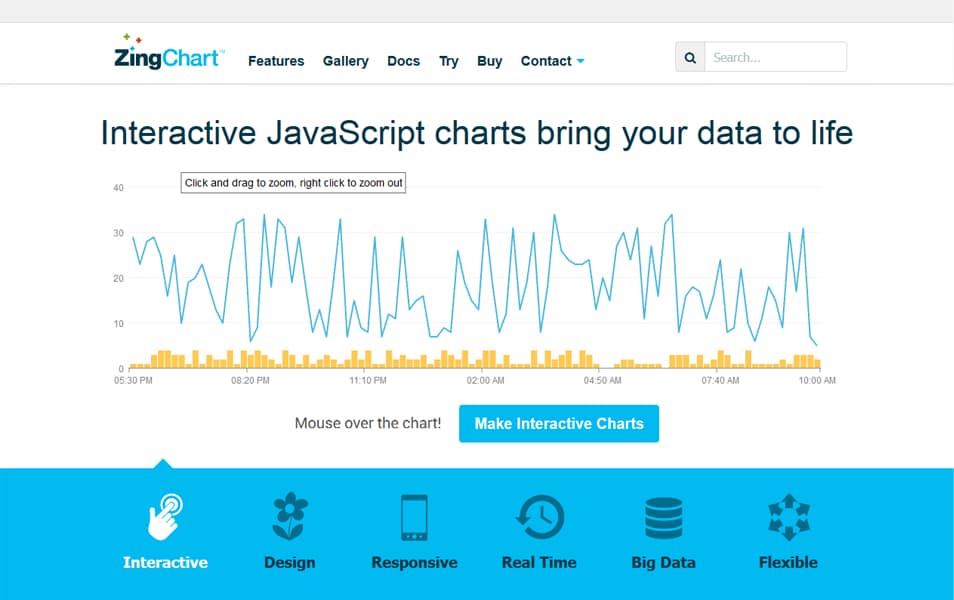
ZingChart


0 Comments